# install fastkaggle if not availabletry: import fastkaggleexcept ModuleNotFoundError:!pip install -Uq fastkagglefrom fastkaggle import*
WARNING: Running pip as the 'root' user can result in broken permissions and conflicting behaviour with the system package manager. It is recommended to use a virtual environment instead: https://pip.pypa.io/warnings/venv
what is multi-target for; why would multi-target be useful
This is part 4 of the Road to the Top series, in which I show the process I used to tackle the Paddy Doctor competition. The first three parts show the process I took that lead to four 1st place submissions. This part onwards discusses various extensions and advanced tricks you might want to consider – but which I don’t promise will necessarily help your score (you’ll need to do your own experiments to figure this out!) If you haven’t read the rest of this series yet, I’d suggest starting at part 1.
In this notebook we’re going to build a model that doesn’t just predict what disease the rice paddy has, but also predicts what kind of rice is shown.
This might sound like a bad idea. After all, doesn’t that mean that the model has more to do? Mightn’t it get rather distracted from its main task, which is to identify paddy disease?
Perhaps… But in previous projects I’ve often found the opposite to be true, especially when training for quite a few epochs. By giving the model more signal about what is present in a picture, it may be able to use this information to find more interesting features that predict our target of interest. For instance, perhaps some of the features of disease change between varieties.
Multi-output DataLoader
how to get dataset and libraries ready for Kaggle’s Paddy Doctor competition
First we’ll repeat the steps we used last time to access the data and ensure all the latest libraries are installed:
how to read a csv into a pandas dataframe and select a column to be its index column
Here’s the CSV that Kaggle provides, showing the variety of rice contained in each image – we’ll make image_id the index of our data frame so that we can look up images directly to grab their variety:
how to extract a particular info from a row using an index from the index column and the column of interest with df.loc
Pandas uses the loc attribute to look up rows by index. Here’s how we can get the variety of image 100330.jpg, for instance:
df.loc['100330.jpg', 'variety']
'ADT45'
how to get the rice variety of each image with df.loc and the path from get_image_files
Our DataBlock will be using get_image_files to get the list of training images, which returns Path objects. Therefore, to look up an item to get its variety, we’ll need to pass its name. Here’s a function which does just that:
how to use DataBlock to create dataloaders; what is DataBlock
We’re now ready to create our DataLoaders. To do this, we’ll use the DataBlock API, which is a flexible and convenient way to plug pieces of a data processing pipeline together:
These are the same item and batch transforms we’ve used in previous notebooks.
how to display 6 images from a batch
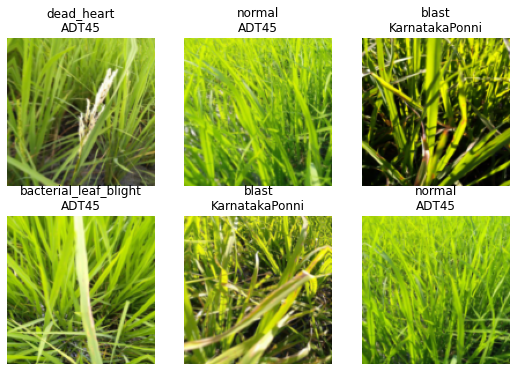
Let’s take a look at part of a batch of this data:
dls.show_batch(max_n=6)
We can see that fastai has created both the image input and two categorical outputs that we requested!
Replicating the disease model
how to create disease error-rate and disease entropy loss functions to receive 3 instead of 2 inputs
Now we’ll replicate the same disease model we’ve made before, but have it work with this new data.
The key difference is that our metrics and loss will now receive three things instead of two: the model outputs (i.e. the metric and loss function inputs), and the two targets (disease and variety). Therefore, we need to define slight variations of our metric (error_rate) and loss function (cross_entropy) to pass on just the disease target:
how to create a vision learner using vision_learner which specifies loss_func, metrics, n_out (num of outputs)
We’re now ready to create our learner.
There’s just one wrinkle to be aware of. Now that our DataLoaders is returning multiple targets, fastai doesn’t know how many outputs our model will need. Therefore we have to pass n_out when we create our Learner – we need 10 outputs, one for each possible disease:
Downloading: "https://dl.fbaipublicfiles.com/convnext/convnext_small_22k_224.pth" to /root/.cache/torch/hub/checkpoints/convnext_small_22k_224.pth
When we train this model we should get similar results to what we’ve seen with similar models before:
learn.fine_tune(5, lr)
epoch
train_loss
valid_loss
disease_err
time
0
1.367007
0.755765
0.248919
02:00
epoch
train_loss
valid_loss
disease_err
time
0
0.699962
0.519963
0.168669
01:57
1
0.548859
0.298034
0.101874
01:55
2
0.322040
0.197317
0.057184
01:54
3
0.209926
0.137812
0.041326
01:54
4
0.153729
0.128756
0.038443
01:54
Multi-target model
how to make the vision_learner to return 20 outputs, 10 for diseases, 10 for varieties; how to use to_fp16
In order to predict both the probability of each disease, and of each variety, we’ll now need the model to output a tensor of length 20, since there are 10 possible diseases, and 10 possible varieties. We can do this by setting n_out=20:
how to split the inputs for creating entropy loss for disease and variety
We can define disease_loss just like we did previously, but with one important change: the input tensor is now length 20, not 10, so it doesn’t match the number of possible diseases. We can pick whatever part of the input we want to be used to predict disease. Let’s use the first 10 values:
Well… if you actually want a model that predicts multiple things, then yes, definitely! But as to whether it’s going to help us better predict rice disease, I honestly don’t know. I haven’t come across any research that tackles this important question: when can a multi-target model improve the accuracy of the individual targets compared to a single target model? (That doesn’t mean it doesn’t exist of course – perhaps it does and I haven’t found it yet…)
I’ve certainly found in previous projects that there are cases where improvements to single targets can be made by using a multi-target model. I’d guess that it’ll be most useful when you’re having problems with overfitting. So try doing this with more epochs, and let me know how you go!
If you found this notebook useful, please remember to click the little up-arrow at the top to upvote it, since I like to know when people have found my work useful, and it helps others find it too. And if you have any questions or comments, please pop them below – I read every comment I receive.
# This is what I use to push my notebook from my home PC to Kaggleifnot iskaggle: push_notebook('jhoward', 'multi-target-road-to-the-top-part-4', title='Multi-target: Road to the Top, Part 4',file='11-multitask.ipynb', competition=comp, private=False, gpu=True)